

“How many new users have we got yesterday?” “Is that more than what we had two days ago?” If you’ve ever encountered these questions, you’re in luck! Today, we’ll be taking a look into the Elastic Stack, and we’ll see how we can get it running alongside a Laravel application. I’ll then show you how to log every new user that registers, so you can keep track of your app’s exponential rise to success!
The Elastic stack is hugely powerful, and a great tool in any developer’s arsenal. Since this is an intro I’ll keep it simple but please let me know if you’re interested in seeing more of this! You can find me on twitter or in the Laravel category of our Fly.io community.
So, what is the Elastic stack?
Simply put, the Elastic stack (formerly known as the ELK stack) is a group of applications for processing data, handling and indexing it, and presenting that data. It is widely used for logging, searching, analytics, and many more. We will be focusing on the logging part today, which is a common use case for application developers like yourself.
If you want more info about the Elastic stack, the people that built it explain everything clearer than I ever could right here: What is the elk stack?.
Setting up the applications
Let’s kick things off with setting up our applications. After that, we’ll add the Laravel logic to write the logs and then I’ll show you how to set up Kibana.
We will be creating four applications on Fly.io: a Laravel app with a MySQL database app, and then an Elasticsearch and a Kibana app. We will not be using Logstash or Beats, because we can log directly from Laravel to Elasticsearch. Also, this will shorten this article a bit so your brain won’t be cooking at the end.
A humble suggestion
You are free to set up the applications however you’d like, but here’s how I set them up: I created a logging-app directory and in there, I made a directory for every application, like this:
- logging-app
- laravel
- mysql
- elasticsearch
- kibana
Making a new Laravel app
For this example application, we will be using Breeze and Livewire, along with a mySQL database. You can find all the information you need right here: https://fly.io/laravel-bytes/full-stack-laravel/
In short, we need to create a new Laravel application, install Breeze, and then connect it to a newly set up mySQL database. Don’t forget to run the migrations after setting everything up! Pro tip: The full-stack Laravel article talks about automating this in the migrate on deploy section.
Once we can log in and register users, we can get the logging side of things running!
Setting up Elasticsearch
As explained in the intro, we will be setting up Elasticsearch and Kibana. To begin, go to the official Elastic dockerfile repository https://github.com/elastic/dockerfiles and download the Elastic and Kibana repositories. We will need the entire directories, not just the dockerfiles! We will also need to make some changes to get everything running correctly. Worry not, I’ll guide you through it!
Let’s take a look at the customized Elastic dockerfile first:
################################################################################
# This Dockerfile was generated from the template at distribution/src/docker/Dockerfile
#
# Beginning of multi stage Dockerfile
################################################################################

################################################################################
# Build stage 1 `builder`:
# Extract Elasticsearch artifact
################################################################################

FROM ubuntu:20.04 AS builder

# Install required packages to extract the Elasticsearch distribution

RUN for iter in 1 2 3 4 5 6 7 8 9 10; do \
      apt-get update && DEBIAN_FRONTEND=noninteractive apt-get install -y curl && \
      exit_code=0 && break || \
        exit_code=$? && echo "apt-get error: retry $iter in 10s" && sleep 10; \
    done; \
    exit $exit_code

# `tini` is a tiny but valid init for containers. This is used to cleanly
# control how ES and any child processes are shut down.
#
# The tini GitHub page gives instructions for verifying the binary using
# gpg, but the keyservers are slow to return the key and this can fail the
# build. Instead, we check the binary against the published checksum.
RUN set -eux ; \
    tini_bin="" ; \
    case "$(arch)" in \
        aarch64) tini_bin='tini-arm64' ;; \
        x86_64)  tini_bin='tini-amd64' ;; \
        *) echo >&2 ; echo >&2 "Unsupported architecture $(arch)" ; echo >&2 ; exit 1 ;; \
    esac ; \
    curl --retry 10 -S -L -O https://github.com/krallin/tini/releases/download/v0.19.0/${tini_bin} ; \
    curl --retry 10 -S -L -O https://github.com/krallin/tini/releases/download/v0.19.0/${tini_bin}.sha256sum ; \
    sha256sum -c ${tini_bin}.sha256sum ; \
    rm ${tini_bin}.sha256sum ; \
    mv ${tini_bin} /bin/tini ; \
    chmod 0555 /bin/tini

RUN mkdir /usr/share/elasticsearch
WORKDIR /usr/share/elasticsearch

RUN curl --retry 10 -S -L --output /tmp/elasticsearch.tar.gz https://artifacts-no-kpi.elastic.co/downloads/elasticsearch/elasticsearch-8.4.3-linux-$(arch).tar.gz

RUN tar -zxf /tmp/elasticsearch.tar.gz --strip-components=1

# The distribution includes a `config` directory, no need to create it
COPY config/elasticsearch.yml config/
COPY config/log4j2.properties config/log4j2.docker.properties

#  1. Configure the distribution for Docker
#  2. Create required directory
#  3. Move the distribution's default logging config aside
#  4. Move the generated docker logging config so that it is the default
#  5. Reset permissions on all directories
#  6. Reset permissions on all files
#  7. Make CLI tools executable
#  8. Make some directories writable. `bin` must be writable because
#     plugins can install their own CLI utilities.
#  9. Make some files writable
RUN sed -i -e 's/ES_DISTRIBUTION_TYPE=tar/ES_DISTRIBUTION_TYPE=docker/' bin/elasticsearch-env && \
    mkdir data && \
    mv config/log4j2.properties config/log4j2.file.properties && \
    mv config/log4j2.docker.properties config/log4j2.properties && \
    find . -type d -exec chmod 0555 {} + && \
    find . -type f -exec chmod 0444 {} + && \
    chmod 0555 bin/* jdk/bin/* jdk/lib/jspawnhelper modules/x-pack-ml/platform/linux-*/bin/* && \
    chmod 0775 bin config config/jvm.options.d data logs plugins && \
    find config -type f -exec chmod 0664 {} +

################################################################################
# Build stage 2 (the actual Elasticsearch image):
#
# Copy elasticsearch from stage 1
# Add entrypoint
################################################################################

FROM ubuntu:20.04

# Change default shell to bash, then install required packages with retries.
RUN yes no | dpkg-reconfigure dash && \
    for iter in 1 2 3 4 5 6 7 8 9 10; do \
      export DEBIAN_FRONTEND=noninteractive && \
      apt-get update && \
      apt-get upgrade -y && \
-     apt-get install -y --no-install-recommends \
-       ca-certificates curl netcat p11-kit unzip zip && \
+     # CUSTOM install gosu as well
+     apt-get install -y --no-install-recommends \
+       ca-certificates curl netcat p11-kit unzip zip gosu && \
      apt-get clean && \
      rm -rf /var/lib/apt/lists/* && \
      exit_code=0 && break || \
        exit_code=$? && echo "apt-get error: retry $iter in 10s" && sleep 10; \
    done; \
    exit $exit_code

RUN groupadd -g 1000 elasticsearch && \
    adduser --uid 1000 --gid 1000 --home /usr/share/elasticsearch elasticsearch && \
    adduser elasticsearch root && \
    chown -R 0:0 /usr/share/elasticsearch

ENV ELASTIC_CONTAINER true

WORKDIR /usr/share/elasticsearch

COPY --from=builder --chown=0:0 /usr/share/elasticsearch /usr/share/elasticsearch
COPY --from=builder --chown=0:0 /bin/tini /bin/tini

ENV PATH /usr/share/elasticsearch/bin:$PATH

COPY bin/docker-entrypoint.sh /usr/local/bin/docker-entrypoint.sh

+ #CUSTOM copy over my own script
+COPY bin/setup.sh /usr/local/bin/setup.sh

# 1. Sync the user and group permissions of /etc/passwd
# 2. Set correct permissions of the entrypoint
# 3. Ensure that there are no files with setuid or setgid, in order to mitigate "stackclash" attacks.
#    We've already run this in previous layers so it ought to be a no-op.
# 4. Replace OpenJDK's built-in CA certificate keystore with the one from the OS
#    vendor. The latter is superior in several ways.
#    REF: https://github.com/elastic/elasticsearch-docker/issues/171
# 5. Tighten up permissions on the ES home dir (the permissions of the contents are handled earlier)
# 6. You can't install plugins that include configuration when running as `elasticsearch` and the `config`
#    dir is owned by `root`, because the installed tries to manipulate the permissions on the plugin's
#    config directory.
RUN chmod g=u /etc/passwd && \
    chmod 0555 /usr/local/bin/docker-entrypoint.sh && \
+   #CUSTOM: set correct permissions for our own setup.sh script
+   chmod 0555 /usr/local/bin/setup.sh && \
    find / -xdev -perm -4000 -exec chmod ug-s {} + && \
    chmod 0775 /usr/share/elasticsearch && \
    chown elasticsearch bin config config/jvm.options.d data logs plugins

# Update "cacerts" bundle to use Ubuntu's CA certificates (and make sure it
# stays up-to-date with changes to Ubuntu's store)
COPY bin/docker-openjdk /etc/ca-certificates/update.d/docker-openjdk
RUN /etc/ca-certificates/update.d/docker-openjdk

EXPOSE 9200 9300

LABEL org.label-schema.build-date="2022-10-04T10:35:41.162162476Z" \
  org.label-schema.license="Elastic-License-2.0" \
  org.label-schema.name="Elasticsearch" \
  org.label-schema.schema-version="1.0" \
  org.label-schema.url="https://www.elastic.co/products/elasticsearch" \
  org.label-schema.usage="https://www.elastic.co/guide/en/elasticsearch/reference/index.html" \
  org.label-schema.vcs-ref="42f05b9372a9a4a470db3b52817899b99a76ee73" \
  org.label-schema.vcs-url="https://github.com/elastic/elasticsearch" \
  org.label-schema.vendor="Elastic" \
  org.label-schema.version="8.4.3" \
  org.opencontainers.image.created="2022-10-04T10:35:41.162162476Z" \
  org.opencontainers.image.documentation="https://www.elastic.co/guide/en/elasticsearch/reference/index.html" \
  org.opencontainers.image.licenses="Elastic-License-2.0" \
  org.opencontainers.image.revision="42f05b9372a9a4a470db3b52817899b99a76ee73" \
  org.opencontainers.image.source="https://github.com/elastic/elasticsearch" \
  org.opencontainers.image.title="Elasticsearch" \
  org.opencontainers.image.url="https://www.elastic.co/products/elasticsearch" \
  org.opencontainers.image.vendor="Elastic" \
  org.opencontainers.image.version="8.4.3"

+ #CUSTOM entrypoint
+ENTRYPOINT ["/usr/local/bin/setup.sh"]
# Dummy overridable parameter parsed by entrypoint
CMD ["eswrapper"]

-USER elasticsearch:root
+#CUSTOM do not run as elasticsearch but as root
+#USER elasticsearch:root

################################################################################
# End of multi-stage Dockerfile
################################################################################
The main change over the original dockerfile is that we will be using our own script as the entrypoint, which will then run the ‘official’ script later on. This way, we can run our own script as root and run the ‘official’ script as the Elasticsearch user. Running as root means we can set up things up properly. Not to worry, I’ll explain further once we get there. Let’s first take a look at every change over the original file:
- Line 89-91: In build stage 2 we also install gosu, so we can run commands as a different user.
- Line 115-116: we copy over the custom
setup.shscript. - Line 131-132: we set the permissions for our custom script, so it can be executed properly.
- Line 164-165: here we use our custom
setup.shas the entrypoint. - Line 169-170: here we comment out the USER command, so the entrypoint is not run as the elasticsearch user but as root.
After that, we need to create the custom setup.sh script. All it does is set up some configuration on the actual VM where the application runs, and then fires the original entrypoint script as the elasticsearch user. Make sure you create this script in the bin/ directory, the dockerfile will be looking to copy it over from there! Here’s how it looks:
#!/bin/bash

# set some parameters that will be checked when ElasticSearch bootstraps
ulimit -n 65535
ulimit -u 4096
sysctl -w vm.max_map_count=262144

gosu elasticsearch:root /usr/local/bin/docker-entrypoint.sh
What this does is set up some configuration of the VM where it’ll be running, and then it uses gosu to run the original entrypoint as the elasticsearch user. The reason we’re doing it this weird way is because Elasticsearch does some bootstrap checks which will fail without this script. By default, Fly.io will have set these parameters a lot tighter and the checks would fail. If for some reason you can’t fall asleep, you could read up on those checks here: Elasticsearch bootstrap checks.
Finally, we also need to make some small changes in the elasticsearch.yml configuration file. Here’s how it should look:
cluster.name: "docker-cluster"
network.host: 0.0.0.0
# add these:
xpack.security.enabled: false
discovery.type: single-node
Setting xpack.security.enabled to false will turn off a lot of security, which will enable us to use http instead of https. This will simplify our setup a lot since we don’t have to deal with certificates and whatnot, but it’s still a security concern. Since the application will be running on a private network that isn’t publicly available, I’m not too worried about it. You can read more about private networking on Fly here.
That’s all our config done, so we are ready for lunch launch! Launch the app using fly launch but don’t deploy it yet because we’ve got one last change to make. Gotcha!
Launching the app will have generated a new fly.toml file for you automagically. Open it up and under the [[services]] section change the internal_port to 9200, like this:
# ...
[[services]]
  # ...
  internal_port = 9200
  # ...
This is the port that will be used to check if the application is actually running. It’s seen as healthy if the application replies on requests on this port, otherwise it’s seen as unhealthy (you can find more info here. And why exactly do we need this to be 9200? Well, young padawan, because that’s the port Elasticsearch uses by default.
The only thing left to do is to give the app a bit more memory using fly scale memory 1024, otherwise it’ll crash and burn when it’s deployed. Now, you can deploy the app, and get a coffee or some tea brewing while it’s setting up. Once you’re all caffeinated again and your app is running, we can set up the final piece of the puzzle: the Kibana frontend.
Setting up Kibana
Now we’re cooking! Just one more application to set up, and it’s probably the easiest. All we have to do is open up the Kibana directory (you know, the one I told you to download from github) and locate the kibana.yml file. In there, you should find a variable that’s named elasticsearch.hosts. Right now, it’s set to http://elasticsearch:9200 but that won’t work. Change the elasticsearch part of the url to the name of your elasticsearch application, and add .internal after that:
# Default Kibana configuration for docker target
server.host: "0.0.0.0"
server.shutdownTimeout: "5s"
# add your elasticsearch app's name here:
elasticsearch.hosts: [ "http://*YOUR_ELASTICSEARCH_APP_NAME_HERE*.internal:9200" ]
monitoring.ui.container.elasticsearch.enabled: true
Remember that I said using http is not that big of a deal since our apps are in a private network? Well that’s why we add .internal. In my case, my Elasticsearch app is called logging-elasticsearch so my hosts url is http://logging-elasticsearch.internal:9200 .
After that we can launch the app but just like Elasticsearch we can’t deploy it yet. In the generated fly.toml file change the internal_port parameters to 5601, this is the default kibana port. This way, Fly will be able to report that the application is running successfully!
Also, just like with Elasticsearch, scale the memory to 1024MB and deploy!
We’ll quickly check if the app is doing OK by running the fly open command, this will open the public url of the app so we can see if everything has started up all right.
Whew, that was quite a lot. What follows now is the part where we actually code some things instead of setting up applications and wiring up scripts, configs and terminal commands. Let’s go!
Logging when a new user registers
It’s been a while, so here’s a refresher on what we actually set out to do: We want to log every new user that registers on your app to Elasticsearch so you can keep tabs on how many new users have signed up.
One (1) environment change
I’m assuming you’ve already got the database config down, but there’s just one extra change we need to do to get our logging running nicely. If you open the fly.toml of the Laravel application, you’ll see some variables in the [env] section. Comment out the LOG_CHANNEL and the LOG_LEVEL:
    ...
- LOG_CHANNEL = "stderr"
- LOG_LEVEL = "info"
+ #remove these from the env so they won't override the default .env file.
+ #LOG_CHANNEL = "stack"
+ #LOG_LEVEL = "info"
    ...
Here’s why: the environment variables in the fly.toml will override those in the .env file. So, the LOG_CHANNEL variable will be set to stderr by default, which is just the way that Fly can capture and display the logs of a running application. We’ll comment it out and set up the stderr channel later. Don’t worry, I’ll remind you. By commenting these variables out, our app will take them from the .env file instead of fly.toml, which makes more sense in my opinion.
Setting up the logging channel
Now, let’s connect our Laravel application to our ELK logging.
There is some good news and some bad news here. Let me hit you with the good news first: Laravel provides some logging channels out of the box. The bad news is, there is no default channel that will work with Elasticsearch. Not to worry though, we’ll just build our own!
To do this, first install the elasticsearch php SDK:
composer require elasticsearch/elasticsearch
For us to build a logging channel, we will need some information about how these channels work and how they are set up. Under the hood, Laravel uses the Monolog library for logging, which makes it possible to log to all kinds of endpoints. For that, Monolog uses handlers. Luckily for us, there is an ElasticsearchHandler available. You can find the documentation here, under log to databases: documentation.
We can find all the configured logging channels in config/logging.php, all we need to do to add our own logging channel to the channels array and we are good to go. We will use custom as the driver, this way we can use a factory to create our logging channel. Add the following to the channels array in config/logging.php:
'elasticsearch' => [
            'driver' => 'custom',
            'via' => \App\Logging\CreateElasticsearchLogger::class,
            ],
This will create a logging channel called elasticsearch. The handler for this channel will be created using the CreateElasticsearchLogger class. Let’s build that out now:
Create a new class in app/Logging called CreateElasticsearchLogger. In it, we only need one method: __invoke() . This class takes an array and should return a Monolog instance. Here’s how it should look:
namespace App\Logging;

use Elastic\Elasticsearch\ClientBuilder;
use Monolog\Handler\ElasticsearchHandler;
use Monolog\Logger;

class CreateElasticsearchLogger
{
    /**
     * Create a custom Monolog instance.
     *
     * @param  array  $config
     * @return \Monolog\Logger
     */
    public function __invoke(array $config)
    {
        $logger = new Logger('elasticsearch');

        //create the client
        $client = ClientBuilder::create()
                    ->setHosts(['http://logging-elasticsearch.internal:9200'])
                    ->build();

        //create the handler
        $options = [
            'index' => 'user_logs',
            'type' => '_doc'
        ];
        $handler = new ElasticsearchHandler($client, $options, Logger::INFO, true);

        $logger->setHandlers(array($handler));

        return $logger;
    }
}
One thing worth pointing out is the index in the $options array. In Elasticsearch, an index is like a database for mySQL. When we configure our views, we will be able to set an index pattern that specifies what indexes we want it to match. There is a LOT of flexibility here: You could create an index per day, so you can filter out the logging per day. Or perhaps an index per user, so you can see exactly how every user is using your app. Right now we’ll keep it simple and set the index to user_logs .
If you want to use multiple indexes, I’d suggest looking into on-demand channels. They are channels that are built at the moment the app needs it, and would be a good way to use multiple indexes.
Logging a message when a new user subscribes
You’ll remember that we set this whole thing up so you can keep track of how many new users you gained every day, week or month. So, we’ll add a log every time a user registers. Events and Listeners are perfectly suited for this and lucky for us, Breeze already has a Registered event set up! You can find it here: Laravel/vendor/laravel/framework/src/Illuminate/Auth/Events/Registered.php. This event is fired every time a new user registers and is wired up to a Listener that sends out an email to verify the user’s email address. We’ll just add our own Listener to the same event, easy! Here’s how:
php artisan make:listener LogRegisteredUser --event=Registered
the --event flag will set up our listener for use with the Registered event. Do make sure that all references of Registered point to Illuminate/Auth/Events/Registered.
To see what Listeners are connected to this Registered event, head on over to the EventServiceProvider. In the $listen array, the Listeners are connected to their Events. Add our newborn Listener there:
protected $listen = [
    Registered::class => [
        SendEmailVerificationNotification::class,
        # Add this line
+       LogRegisteredUser::class,
    ],
];
All we have to do now is to specify what the LogRegisteredUser listener should actually do. Navigate to LogRegisteredUser and add the following in the preconfigured handle method:
public function handle(Registered $event)
{
+   // add an 'info' log with our new user:
+   Log::info("New user '{$event->user->name}' registered", $event->user->toArray());
}
The Log::info will use the default logging channel that’s specified in logging.php. If we check there we can see it uses the environment variable LOG_CHANNEL, with stack as a fallback. Let’s set it up in our .env-file: find the LOG_CHANNEL variable and set it to stack. It makes the most sense to put this kind of config in the .env file, if you ask me.
One other thing to note: the Log::... methods can take one or two parameters with the second one being the context. We pass along our User object, which will be really useful in Kibana. Don’t worry, it’ll make sense when we get there.
Finally, go to logging.php and find the stack channel. This is the channel that consists of multiple channels, so logs can be sent to different locations based on the level of the log. In the channels array, add stderr and elasticsearch. Here’s how the stack channel should look like now:
'stack' => [
    'driver' => 'stack',
-   'channels' => ['single'],
+   'channels' => ['single','elasticsearch','stderr'], # also log to elasticsearch and fly logs
    'ignore_exceptions' => false,
],
If you recall, the stderr channel is the one that makes the Fly logs work, and we removed it from the env-section in the fly.toml file so don’t forget to add it here!
Now, redeploy the changes to Fly to update the running application using fly deploy. Then, register a new user to trigger our Listener. After that, head on over to Kibana to take a look at our logs! Remember, you can do this by going to your app’s URL found in the fly dashboard, or by using the fly open command in the directory where Kibana’s fly.toml file is located. See you on the flip side!
Configuring Kibana
This is it. The moment you’ve been waiting for. The final chapter. This is the moment where we… will display logs in Kibana! Okay, I may have overdone the drama a little bit. Anyhow, let’s see how we can show our logs:
In Kibana, open up the menu on the left, scroll down and the stack management tab. Then, select data views on the left. You should see Kibana getting snarky and telling us we first need data. Who does that guy think he is? It has a point though, we will need some data and we’ll get some right now!
Open up your laravel app in a new tab and register a new user. This should send out the Register event which will in turn fire our LogRegisteredUser listener. After that, hit reload in the Kibana tab and if everything is set up correctly, we should see Kibana has calmed down and tells us we hava data in Elasticsearch. All we need to do now is create a data view. Click the very clickable blue button that says create data view in the middle of the page. Here we can see how a data view relates to the indexes in Elasticsearch: a pattern matches one or more indexes. Using the right pattern we could get all the logs for a month, for a specific user, or for a specific feature in your app. The possibilities are basically endless, you just set up the indexes and data views the way you want!
For now, just use a pattern like user* . As the timestamp field we can use context.created_at. Remember when I was rattling about the context and how we should add it to our logs? This is why: Since we added the User as context, Elasticsearch can see all the fields of the User object and display them in tables, graphs, charts and well, basically everywhere. Neat!
Once the data view is created, hop on over to Analytics - discover in the sidebar on the left. Here we can see all the logs in a specific time range.
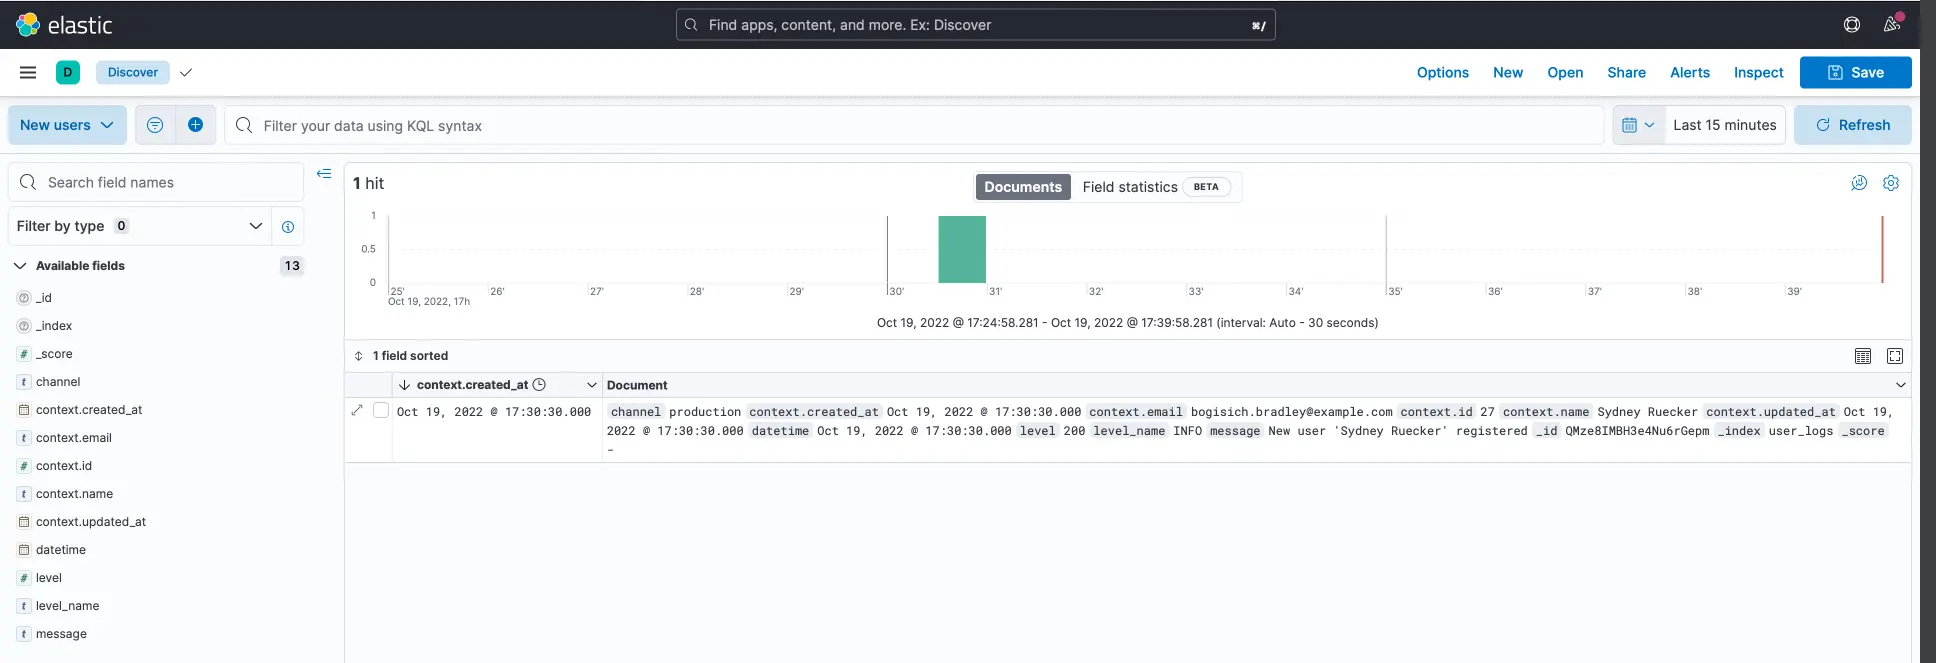
On the left, we can see all the fields Elasticsearch has found. We logged the complete user object in the context field so we can display everything we want here, even if we make changes to the user model later on!
There is a whole lot more to explore here, this has just been us dipping our little toe in the deep waters of the Elastic stack. It has been enough for a simple use case, so I’ll wrap it up here. Maybe you could set up a dashboard that shows how much new users have registered for each day of the past week? I’ll let you figure that one out on your own.
Thanks a lot for reading, and don’t be afraid to let me know if something doesn’t work for you, if there’s a weird typo or if you’d like me to continue writing about the Elastic stack!
Fly.io ❤️ Laravel
Fly.io is a great way to run your Laravel Livewire app close to your users. Deploy globally on Fly in minutes!
Deploy your Laravel app! →